
Page 220 - Demo
P. 220
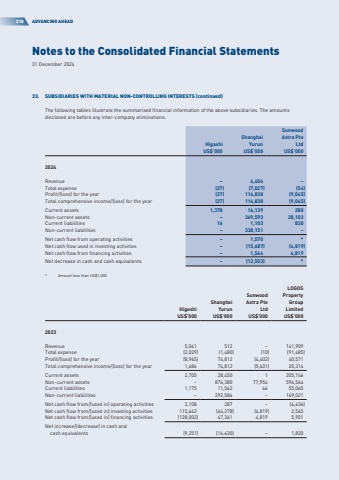
Notes to the Consolidated Financial Statements31 December 2024218ADVANCING AHEAD33.SUBSIDIARIES WITH MATERIAL NON-CONTROLLING INTERESTS (continued)The following tables illustrate the summarised financial information of the above subsidiaries. The amounts disclosed are before any inter-company eliminations:HigashiShanghai YurunSunwood Astra Pte LtdUS$%u2019000US$%u2019000US$%u20190002024Revenue%u20134,406%u2013Total expense(27)(7,027)(54)Profit/(loss) for the year(27)116,838(9,045)Total comprehensive income/(loss) for the year(27)116,838(9,045)Current assets1,37816,139280Non-current assets%u2013369,59328,103Current liabilities161,103838Non-current liabilities%u2013338,151%u2013Net cash flow from operating activities%u20131,570*Net cash flow used in investing activities%u2013(15,687)(4,819)Net cash flow from financing activities%u20131,5644,819Net decrease in cash and cash equivalents%u2013(12,553)**Amount less than US$1,000HigashiShanghai YurunSunwood Astra Pte LtdLOGOS Property Group LimitedUS$%u2019000US$%u2019000US$%u2019000US$%u20190002023Revenue5,041512141,909Total expense(2,029)(1,480)(10)(91,485)Profit/(loss) for the year(8,965)74,812(4,402)40,571Total comprehensive income/(loss) for the year1,68674,812(5,401)20,314Current assets2,70528,4501205,746Non-current assets876,38077,954596,564Current liabilities1,17511,5624655,065Non-current liabilities292,586149,021Net cash flow from/(used in) operating activities3,108287(6,636)Net cash flow from/(used in) investing activities115,643(64,278)(4,819)2,565Net cash flow from/(used in) financing activities(128,002)47,3614,8195,901Net increase/(decrease) in cash and cash equivalents(9,251)(16,630)1,830
