
Page 11 - Demo
P. 11
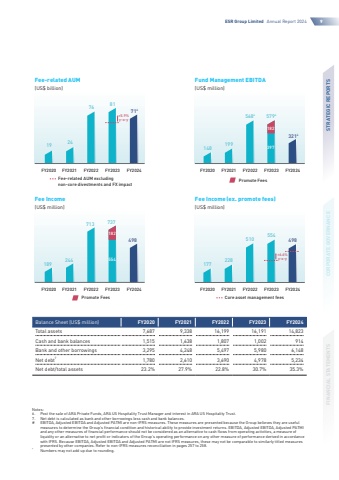
ESR Group Limited Annual Report 20249STRATEGIC REPORTSCORPORATE GOVERNANCEFINANCIAL STATEMENTS81716579439732147374985544987614819956841924177228510189244713182554182Fee-related AUM(US$ billion)Fund Management EBITDA(US$ million)Fee Income(US$ million)Fee Income(ex. promote fees)(US$ million)FY2021Core asset management feesFee-related AUM excludingnon-core divestments and FX impactFY2020FY2022 FY2023 FY2024FY2020FY2021FY2022 FY2023 FY2024FY2020FY2021FY2022 FY2023 FY2024FY2020FY2021FY2022 FY2023 FY2024Promote FeesPromote Fees+5.9%y-o-y+6.6%y-o-yBalance Sheet (US$ million) FY2020 FY2021 FY2022 FY2023 FY2024Total assets 7,6879,33816,19916,19114,823Cash and bank balances 1,5151,6381,8071,002914Bank and other borrowings 3,2954,2485,4975,9806,148Net debt71,7802,6103,6904,9785,234Net debt/total assets 23.2%27.9%22.8%30.7%35.3%Notes:6.Post the sale of ARA Private Funds, ARA US Hospitality Trust Manager and interest in ARA US Hospitality Trust.7.%u0009 Netdebtiscalculatedasbankandotherborrowingslesscashandbankbalances.#EBITDA, Adjusted EBITDA and Adjusted PATMI are non-IFRS measures. These measures are presented because the Group believes they are useful measures to determine the Group%u2019s financial condition and historical ability to provide investment returns. EBITDA, Adjusted EBITDA, Adjusted PATMI and any other measures of financial performance should not be considered as an alternative to cash flows from operating activities, a measure of liquidity or an alternative to net profit or indicators of the Group%u2019s operating performance on any other measure of performance derived in accordance with IFRS. Because EBITDA, Adjusted EBITDA and Adjusted PATMI are not IFRS measures, these may not be comparable to similarly titled measures presentedbyothercompanies.Refertonon-IFRSmeasuresreconciliationinpages257to258.*Numbers may not add up due to rounding.
