
Page 129 - Demo
P. 129
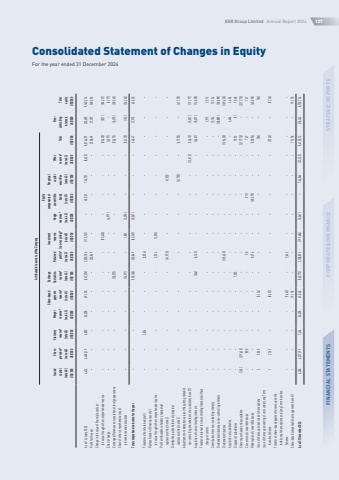
Consolidated Statement of Changes in EquityFor the year ended 31 December 2024ESR Group Limited Annual Report 2024127STRATEGIC REPORTSCORPORATE GOVERNANCEFINANCIAL STATEMENTSAttributable to owners of the CompanyEquityShare-basedExchangeInvestmentcomponents ofPerpetualIssuedShareStatutoryMergerpaymentfluctuationRetainedreserveHedgeconvertiblecapitalOtherNoncapitalpremium*reserve*reserve*reserve*reserve*profits*(non-recycling)*reserves*bondssecuritiesreserve*TotalcontrollingTotal(note 40)(note 40)(note 43)(note 43)(note 41)(note 43)(note 43)(note 43)(note 43)(note 31)(note 42)(note 43)interestsequityUS$%u2019000US$%u2019000US$%u2019000US$%u2019000US$%u2019000US$%u2019000US$%u2019000US$%u2019000US$%u2019000US$%u2019000US$%u2019000US$%u2019000US$%u2019000US$%u2019000US$%u2019000As at 1 January 20234,4226,448,2194,80256,35849,130(467,294)2,050,186(113,741)%u201348,501742,701(8,625)8,814,659325,6559,140,314Profit for the year%u2013%u2013%u2013%u2013%u2013%u2013230,849%u2013%u2013%u2013%u2013%u2013230,84937,207268,056Change in fair value of financial assets at fair value through other comprehensive income%u2013%u2013%u2013%u2013%u2013%u2013%u2013(85,430)%u2013%u2013%u2013%u2013(85,430)(821)(86,251)Effect of hedge%u2013%u2013%u2013%u2013%u2013%u2013%u2013%u2013(4,977)%u2013%u2013%u2013(4,977)%u2013(4,977)Exchange differences on translation of foreign operations%u2013%u2013%u2013%u2013%u2013(50,275)%u2013%u2013%u2013%u2013%u2013%u2013(50,275)(8,270)(58,545)Share of other comprehensive loss of joint ventures and associates%u2013%u2013%u2013%u2013%u2013(54,911)%u20131,881(3,090)%u2013%u2013%u2013(56,120)(143)(56,263)Total comprehensive income for the year%u2013%u2013%u2013%u2013%u2013(105,186)230,849(83,549)(8,067)%u2013%u2013%u201334,04727,97362,020Transferred from retained profit%u2013%u20132,824%u2013%u2013%u2013(2,824)%u2013%u2013%u2013%u2013%u2013%u2013%u2013%u2013Reclassification of financial asset at fair value through other comprehensive income%u2013%u2013%u2013%u2013%u2013%u20132,394(2,394)%u2013%u2013%u2013%u2013%u2013%u2013%u2013Profit attributable to holders of perpetual capital securities (note 42)%u2013%u2013%u2013%u2013%u2013%u2013(41,920)%u2013%u2013%u201341,920%u2013%u2013%u2013%u2013Distribution paid to holders of perpetual capital securities (note 42)%u2013%u2013%u2013%u2013%u2013%u2013%u2013%u2013%u2013%u2013(41,755)%u2013(41,755)%u2013(41,755)Adjustment on redemption value of the option granted to non-controllingshareholdersofasubsidiary(note27)%u2013%u2013%u2013%u2013%u2013%u2013%u2013%u2013%u2013%u2013%u2013(13,610)(13,610)(5,567)(19,177)Acquisition of non-controlling interests%u2013%u2013%u2013%u2013%u2013(346)(6,155)%u2013%u2013%u2013%u2013%u2013(6,501)(8,397)(14,898)Transfer of interest to non-controlling interests without change of control%u2013%u2013%u2013%u2013%u2013%u2013%u2013%u2013%u2013%u2013%u2013%u2013%u20132,9122,912Contribution from non-controlling interests%u2013%u2013%u2013%u2013%u2013%u2013%u2013%u2013%u2013%u2013%u2013%u2013%u201310,15410,154Dividend distributions to non-controlling interests%u2013%u2013%u2013%u2013%u2013%u2013%u2013%u2013%u2013%u2013%u2013%u2013%u2013(38,889)(38,889)Dividend distributions%u2013%u2013%u2013%u2013%u2013%u2013(139,630)%u2013%u2013%u2013%u2013%u2013(139,630)%u2013(139,630)Acquisition of subsidiaries%u2013%u2013%u2013%u2013%u2013%u2013%u2013%u2013%u2013%u2013%u2013%u2013%u20134,4064,406Disposal of subsidiaries%u2013%u2013%u2013%u2013%u20137,053%u2013%u2013%u2013%u2013%u2013%u20137,053(5)7,048Share repurchased and cancellation(145)(217,625)%u2013%u2013%u2013%u2013%u2013%u2013%u2013%u2013%u2013%u2013(217,770)%u2013(217,770)Conversion of convertible bonds%u2013800%u2013%u2013%u2013%u201358%u2013%u2013(111)%u2013%u2013747%u2013747Redemption of convertible bonds%u2013%u2013%u2013%u2013%u2013%u20138,294%u2013%u2013(48,390)%u2013%u2013(40,096)%u2013(40,096)Issue of shares upon exercise of share options23,040%u2013%u2013(3,126)%u2013%u2013%u2013%u2013%u2013%u2013%u2013(84)%u2013(84)Issue of shares upon vesting of units under Long Term Incentive Scheme12,765%u2013%u2013(8,492)%u2013%u2013%u2013%u2013%u2013%u2013%u2013(5,726)%u2013(5,726)Transfer of share-based payment reserve upon the forfeiture of share options and Long Term Incentive Scheme%u2013%u2013%u2013%u2013(7,642)%u20137,642%u2013%u2013%u2013%u2013%u2013%u2013%u2013%u2013Share-based compensation arrangement (note 41)%u2013%u2013%u2013%u201319,178%u2013%u2013%u2013%u2013%u2013%u2013%u201319,178%u201319,178As at 31 December 20234,2806,237,1997,62656,35849,048(565,773)2,108,894(199,684)(8,067)%u2013742,866(22,235)8,410,512318,2428,728,754
