
Page 88 - Demo
P. 88
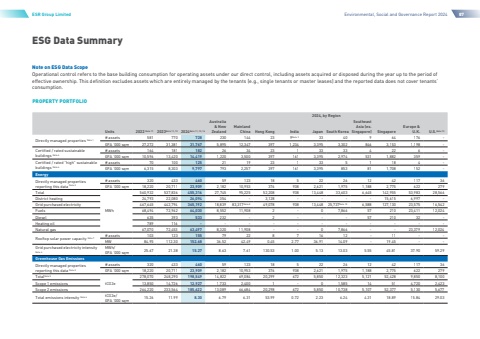
ESG Data SummaryESR Group LimitedEnvironmental, Social and Governance Report 202487Note on ESG Data ScopeOperational control refers to the base building consumption for operating assets under our direct control, including assets acquired or disposed during the year up to the period of effective ownership. This definition excludes assets which are entirely managed by the tenants (e.g., single tenants or master leases) and the reported data does not cover tenants%u2019 consumption.PROPERTY PORTFOLIO2024, by RegionUnits2022 Note 112023Note 11, 122024Note 11, 12, 14Australia& NewZealandMainlandChinaHong KongIndiaJapanSouth KoreaSoutheastAsia (ex.Singapore)SingaporeEurope &U.K.U.S.Note 13Directly managed properties Note 1# assets581770728230144239Note 93340964176GFA %u2019000 sqm 27,27231,38131,7675,89512,3473971,2343,3953,3028463,1531,198Certified / rated sustainable buildings Note 6# assets164181182263423133334226-GFA %u2019000 sqm10,59613,42014,4191,2203,5003971613,3952,9745311,882359Certified / rated %u201chigh%u201d sustainable buildings Note 6# assets7010012521192313351184GFA %u2019000 sqm6,3158,3039,7977932,2573971613,395853811,708152-EnergyDirectly managed properties reporting this data Note 2# assets320433460591231852226124211736GFA %u2019000 sqm18,22020,71123,9092,18210,9533769382,6211,9751,1882,775622279TotalMWh560,932537,836455,31627,74595,22552,20893813,44833,6036,645142,95553,98328,566District heating24,79322,08026,0943543,12815,6156,997Grid purchased electricity467,645442,794365,19218,83983,317Note 849,07893813,44825,737Note 106,588127,13023,57516,542Fuels68,49472,96264,0308,55211,9082-07,8665721023,41112,024Diesel63539353323225721032Heating oil789116-Natural gas67,07072,45363,4978,32011,908--07,866--23,37912,024Rooftop solar power capacity Note 7# assets103123155792287161211MW84.95112.30152.6836.5242.490.452.7736.9114.0919.45Grid purchased electricity intensity Note 4MWh/GFA %u2019000 sqm25.6721.3815.278.637.61130.531.005.1313.035.5545.8137.9059.29Greenhouse Gas EmissionsDirectly managed properties reporting this data Note 2# assets320433460591231852226124211736GFA %u2019000 sqm18,22020,71123,9092,18210,9533769382,6211,9751,1882,775622279TotalNote 5tCO2e278,070248,290198,54914,82269,08420,2996725,85012,3235,12152,4289,8508,100Scope 1 emissions13,85014,72612,9271,7332,400101,58514514,7202,423Scope 2 emissions 264,220233,564185,62213,08966,68420,2986725,85010,7385,10752,3775,1305,677Total emissions intensity Note 4tCO2e/GFA %u2019000 sqm15.2611.998.306.796.3153.990.722.236.244.3118.8915.8429.03
