
Page 89 - Demo
P. 89
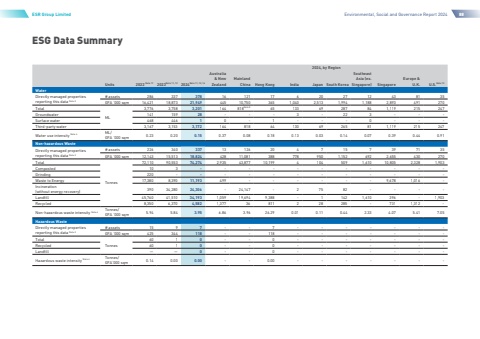
ESG Data SummaryESR Group LimitedEnvironmental, Social and Governance Report 2024882024, by RegionUnits2022 Note 112023Note 11, 122024Note 11, 12, 14Australia& NewZealandMainlandChinaHong KongIndiaJapanSouth KoreaSoutheastAsia (ex.Singapore)SingaporeEurope &U.K.U.S.Note 13WaterDirectly managed properties reporting this data Note 2# assets28633737816121176202712438135GFA %u2019000 sqm16,42118,87321,94944510,7503651,0402,5131,9941,1882,893491270TotalML3,7763,7583,201164818Note 86513369287841,119215247Groundwater141159283223Surface water46844610-1---0---Third-party water3,1673,1533,1721648186413069265811,119215247Water use intensity Note 4ML/GFA %u2019000 sqm0.230.200.150.370.080.180.130.030.140.070.390.440.91Non-hazardous WasteDirectly managed properties reporting this data Note 3# assets226340337131262047157397135GFA %u2019000 sqm12,14315,51318,82442811,0813887789501,1526922,655430270TotalTonnes72,11090,55374,2742,93543,87710,19941045091,61010,8052,3281,903Composted103-----------Grinding220-Waste to Energy17,3808,39011,193499------9,6781,016-Incineration (without energy recovery)39034,28024,30624,14727582Landfill45,76041,51034,1931,05919,6949,38811421,6103961,903Recycled8,3506,3704,5821,37736811228285-7311,312-Non-hazardous waste intensity Note 4Tonnes/GFA %u2019000 sqm5.945.843.956.863.9626.290.010.110.442.334.075.417.05Hazardous WasteDirectly managed properties reporting this data Note 3# assets15977GFA %u2019000 sqm425344118--118-------TotalTonnes60100Recycled60100Landfill%u2014%u20140--0-------Hazardous waste intensity Note 4Tonnes/GFA%u2019000 sqm0.140.000.00--0.00-------
