
Page 169 - Demo
P. 169
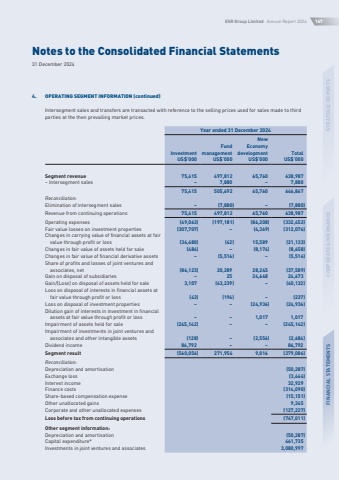
Notes to the Consolidated Financial Statements31 December 2024ESR Group Limited Annual Report 2024167STRATEGIC REPORTSCORPORATE GOVERNANCEFINANCIAL STATEMENTS4.OPERATING SEGMENT INFORMATION (continued)Intersegment sales and transfers are transacted with reference to the selling prices used for sales made to third parties at the then prevailing market prices.Year ended 31 December 2024InvestmentFundmanagementNew EconomydevelopmentTotalUS$%u2019000US$%u2019000US$%u2019000US$%u2019000Segment revenue75,415497,81265,760638,987%u2013 Intersegment sales%u20137,880%u20137,88075,415505,69265,760646,867Reconciliation:Elimination of intersegment sales%u2013(7,880)%u2013(7,880)Revenue from continuing operations75,415497,81265,760638,987Operating expenses(49,063)(197,181)(86,208)(332,452)Fair value losses on investment properties(307,707)%u2013(4,369)(312,076)Changes in carrying value of financial assets at fair value through profit or loss(36,680)(42)15,589(21,133)Changes in fair value of assets held for sale(484)%u2013(8,174)(8,658)Changes in fair value of financial derivative assets%u2013(5,516)%u2013(5,516)Share of profits and losses of joint ventures and associates, net(86,123)20,28928,245(37,589)Gain on disposal of subsidiaries%u20132524,64824,673Gain/(Loss) on disposal of assets held for sale3,107(43,239)%u2013(40,132)Loss on disposal of interests in financial assets at fair value through profit or loss(43)(194)%u2013(237)Loss on disposal of investment properties%u2013%u2013(24,936)(24,936)Dilution gain of interests in investment in financial assets at fair value through profit or loss%u2013%u20131,0171,017Impairment of assets held for sale(245,142)%u2013%u2013(245,142)Impairment of investments in joint ventures and associates and other intangible assets(128)%u2013(2,556)(2,684)Dividend income86,792%u2013%u201386,792Segment result(560,056)271,9549,016(279,086)Reconciliation:Depreciation and amortisation(50,287)Exchange loss(3,444)Interest income32,929Finance costs(314,090)Share-based compensation expense(15,151)Other unallocated gains9,345Corporate and other unallocated expenses(127,227)Loss before tax from continuing operations(747,011)Other segment information:Depreciation and amortisation(50,287)Capital expenditure*461,735Investments in joint ventures and associates3,080,997
