
Page 187 - Demo
P. 187
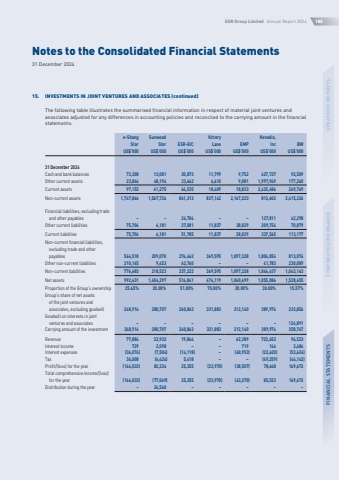
Notes to the Consolidated Financial Statements31 December 2024ESR Group Limited Annual Report 2024185STRATEGIC REPORTSCORPORATE GOVERNANCEFINANCIAL STATEMENTS15.INVESTMENTS IN JOINT VENTURES AND ASSOCIATES (continued)The following table illustrates the summarised financial information in respect of material joint ventures and associates adjusted for any differences in accounting policies and reconciled to the carrying amount in the financial statements:e-ShangStarSunwoodStarESR-GICVictoryLaneEMPKenedix,IncBWUS$%u2019000US$%u2019000US$%u2019000US$%u2019000US$%u2019000US$%u2019000US$%u201900031 December 2024Cash and bank balances73,30813,08130,87311,7999,752427,73792,509Other current assets23,84448,19433,6626,6109,0811,997,949177,260Current assets97,15261,27564,53518,40918,8332,425,686269,769Non-current assets1,747,8661,567,726841,313837,1422,167,223813,6022,415,226Financial liabilities, excluding trade and other payables%u2013%u201324,704%u2013%u2013127,81142,298Other current liabilities75,7046,18127,08111,83728,029209,75470,879Current liabilities75,7046,18151,78511,83728,029337,565113,177Non-current financial liabilities, excluding trade and other payables566,518209,070274,462369,5951,097,3281,804,854813,074Other non-current liabilities210,1659,45362,760%u2013%u201341,783230,089Non-current liabilities776,683218,523337,222369,5951,097,3281,846,6371,043,163Net assets992,6311,404,297516,841474,1191,060,6991,055,0861,528,655Proportion of the Group%u2019s ownership25.65%20.00%51.00%70.00%20.00%30.00%15.57%Group%u2019s share of net assets of the joint ventures and associates, excluding goodwill248,914280,707260,863331,883212,140389,974233,856Goodwill on interests in joint ventures and associates%u2013%u2013%u2013%u2013%u2013%u2013124,891Carrying amount of the investment248,914280,707260,863331,883212,140389,974358,747Revenue77,88433,93219,844%u201362,389723,65394,523Interest income7292,098%u2013%u20137191443,484Interest expenses(36,074)(7,504)(14,118)%u2013(60,953)(22,620)(53,624)Tax36,008(6,424)5,418%u2013%u2013(49,259)(44,142)Profit/(loss) for the year(144,033)82,33425,355(23,970)(38,507)78,648169,672Total comprehensive income/(loss) for the year(144,033)(77,069)25,355(23,970)(43,270)85,523169,672Distribution during the year%u201324,540%u2013%u2013%u2013%u2013%u2013
