
Page 28 - Demo
P. 28
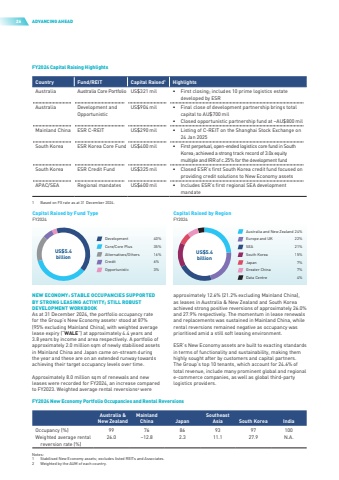
26ADVANCING AHEADFY2024 Capital Raising HighlightsCountryFund/REITCapital Raised1HighlightsAustraliaAustralia Core PortfolioUS$321 mil%u2022%u0009 Firstclosing;includes10primelogisticsestatedeveloped by ESRAustraliaDevelopment and OpportunisticUS$904 mil%u2022%u0009 FinalcloseofdevelopmentpartnershipbringstotalcapitaltoAU$700mil%u2022%u0009 Closedopportunisticpartnershipfundat~AU$800milMainland ChinaESR C-REITUS$290 mil%u2022%u0009 ListingofC-REITontheShanghaiStockExchangeon24 Jan 2025South KoreaESR Korea Core FundUS$400 mil%u2022%u0009 Firstperpetual,open-endedlogisticscorefundinSouthKorea; achieved a strong track record of 3.0x equity multiple and IRR of c.25% for the development fundSouth KoreaESR Credit FundUS$325 mil%u2022%u0009 ClosedESR%u2019sfirstSouthKoreacreditfundfocusedonproviding credit solutions to New Economy assetsAPAC/SEARegional mandatesUS$600 mil%u2022%u0009 IncludesESR%u2019sfirstregionalSEAdevelopmentmandate1Based on FX rate as at 31 December 2024.40%35%16%3%6%US$5.4billionDevelopmentCore/Core PlusAlternatives/OthersOpportunisticCreditCapital Raised by Fund TypeFY202424%22%7%4%21%7%15%Australia and New ZealandEurope and UKGreater ChinaData CentreSEAJapanSouth KoreaUS$5.4billionCapital Raised by RegionFY2024FY2024 New Economy Portfolio Occupancies and Rental ReversionsAustralia & New ZealandMainland ChinaJapanSoutheast AsiaSouth KoreaIndiaOccupancy (%)9976869397100Weighted average rental reversion rate (%)26.0%u201312.82.311.127.9N.A.Notes:1Stabilised New Economy assets; excludes listed REITs and Associates.2Weighted by the AUM of each country.NEW ECONOMY: STABLE OCCUPANCIES SUPPORTED BY STRONG LEASING ACTIVITY; STILL ROBUST DEVELOPMENT WORKBOOKAs at 31 December 2024, the portfolio occupancy rate for the Group%u2019s New Economy assets1stoodat87%(95% excluding Mainland China), with weighted average lease expiry (%u201cWALE%u201d) at approximately 4.4 years and 3.8 years by income and area respectively. A portfolio of approximately 2.0 million sqm of newly stabilised assets in Mainland China and Japan came on-stream during the year and these are on an extended runway towards achieving their target occupancy levels over time.Approximately 8.0 million sqm of renewals and new leases were recorded for FY2024, an increase compared to FY2023. Weighted average rental reversions2 were approximately 12.6% (21.2% excluding Mainland China), as leases in Australia & New Zealand and South Korea achieved strong positive reversions of approximately 26.0% and27.9%respectively.Themomentuminleaserenewalsand replacements was sustained in Mainland China, while rental reversions remained negative as occupancy was prioritised amid a still soft leasing environment.ESR%u2019s New Economy assets are built to exacting standards in terms of functionality and sustainability, making them highly sought after by customers and capital partners. The Group%u2019s top 10 tenants, which account for 24.6% of total revenue, include many prominent global and regional e-commerce companies, as well as global third-party logistics providers.
