
Page 32 - Demo
P. 32
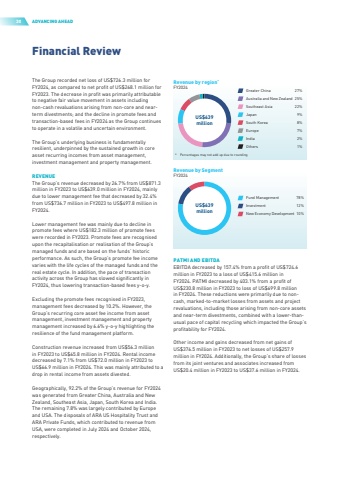
30ADVANCING AHEAD27%9%2%7%1%8%22%25%Greater ChinaJapanIndiaEuropeOthers* Percentages may not add up due to roundingSouth KoreaSoutheast AsiaAustralia and New ZealandUS$639millionRevenue by region*FY202412%78%10%InvestmentFund ManagementNew Economy DevelopmentUS$639millionRevenue by SegmentFY2024 PATMI AND EBITDAEBITDAdecreasedby157.4%fromaprofitofUS$724.6million in FY2023 to a loss of US$415.6 million in FY2024. PATMI decreased by 403.1% from a profit of US$230.8 million in FY2023 to loss of US$699.8 million in FY2024. These reductions were primarily due to noncash, marked-to-market losses from assets and project revaluations, including those arising from non-core assets and near-term divestments, combined with a lower-thanusual pace of capital recycling which impacted the Group%u2019s profitability for FY2024.Other income and gains decreased from net gains of US$376.5millioninFY2023tonetlossesofUS$257.9million in FY2024. Additionally, the Group%u2019s share of losses from its joint ventures and associates increased from US$20.4millioninFY2023toUS$37.6millioninFY2024.Financial ReviewTheGrouprecordednetlossofUS$726.3millionforFY2024, as compared to net profit of US$268.1 million for FY2023. The decrease in profit was primarily attributable to negative fair value movement in assets including non-cash revaluations arising from non-core and nearterm divestments; and the decline in promote fees and transaction-based fees in FY2024 as the Group continues to operate in a volatile and uncertain environment. The Group%u2019s underlying business is fundamentally resilient, underpinned by the sustained growth in core asset recurring incomes from asset management, investment management and property management.REVENUETheGroup%u2019srevenuedecreasedby26.7%fromUS$871.3million in FY2023 to US$639.0 million in FY2024, mainly due to lower management fee that decreased by 32.4% fromUS$736.7millioninFY2023toUS$497.8millioninFY2024.Lower management fee was mainly due to decline in promote fees where US$182.3 million of promote fees were recorded in FY2023. Promote fees are recognised upon the recapitalisation or realisation of the Group%u2019s managed funds and are based on the funds%u2019 historic performance. As such, the Group%u2019s promote fee income varies with the life cycles of the managed funds and the real estate cycle. In addition, the pace of transaction activity across the Group has slowed significantly in FY2024, thus lowering transaction-based fees y-o-y.Excluding the promote fees recognised in FY2023, management fees decreased by 10.2%. However, the Group%u2019s recurring core asset fee income from asset management, investment management and property management increased by 6.6% y-o-y highlighting the resilience of the fund management platform.Construction revenue increased from US$56.3 million in FY2023 to US$65.8 million in FY2024. Rental income decreasedby7.1%fromUS$72.0millioninFY2023toUS$66.9 million in FY2024. This was mainly attributed to a drop in rental income from assets divested.Geographically, 92.2% of the Group%u2019s revenue for FY2024 was generated from Greater China, Australia and New Zealand, Southeast Asia, Japan, South Korea and India. Theremaining7.8%waslargelycontributedbyEuropeand USA. The disposals of ARA US Hospitality Trust and ARA Private Funds, which contributed to revenue from USA, were completed in July 2024 and October 2024, respectively.
