
Page 29 - Demo
P. 29
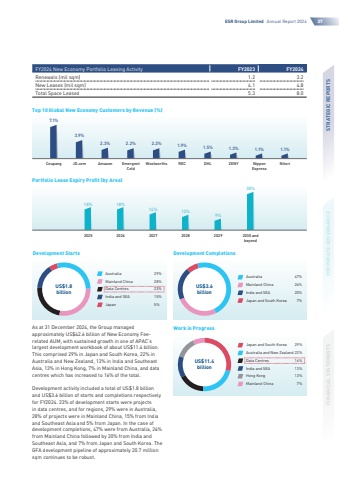
ESR Group Limited Annual Report 202427STRATEGIC REPORTSCORPORATE GOVERNANCEFINANCIAL STATEMENTS18%18%14%12%9%30%Portfolio Lease Expiry Profit (by Area)202520262027202820292030 andbeyond7.1%3.9%2.3%2.2%2.2%1.9%1.5%1.3%1.1%1.1%Top 10 Global New Economy Customers by Revenue (%)Coupang JD.com Amazon EmergentColdWoolworths REC DHL ZENY NipponExpressNitoriAs at 31 December 2024, the Group managed approximately US$42.6 billion of New Economy Feerelated AUM, with sustained growth in one of APAC%u2019s largest development workbook of about US$11.4 billion. This comprised 29% in Japan and South Korea, 22% in Australia and New Zealand, 13% in India and Southeast Asia,13%inHongKong,7%inMainlandChina,anddatacentres which has increased to 16% of the total.Development activity included a total of US$1.8 billion and US$3.6 billion of starts and completions respectively for FY2024. 23% of development starts were projects in data centres, and for regions, 29% were in Australia, 28% of projects were in Mainland China, 15% from India and Southeast Asia and 5% from Japan. In the case of developmentcompletions,47%werefromAustralia,26%from Mainland China followed by 20% from India and SoutheastAsia,and7%fromJapanandSouthKorea.TheGFAdevelopmentpipelineofapproximately20.7millionsqm continues to be robust.29%28%23%5%15%US$1.8billionAustraliaMainland ChinaData CentresJapanIndia and SEADevelopment Starts47%26%20%7%US$3.6billionAustraliaMainland ChinaIndia and SEAJapan and South KoreaDevelopment Completions29%22%7%16%13%13%Japan and South KoreaAustralia and New ZealandMainland ChinaData CentresHong KongIndia and SEAUS$11.4billionWork in ProgressFY2024 New Economy Portfolio Leasing ActivityFY2023 FY2024Renewals (mil sqm)1.23.2New Leases (mil sqm)4.14.8Total Space Leased5.38.0
