
Page 258 - Demo
P. 258
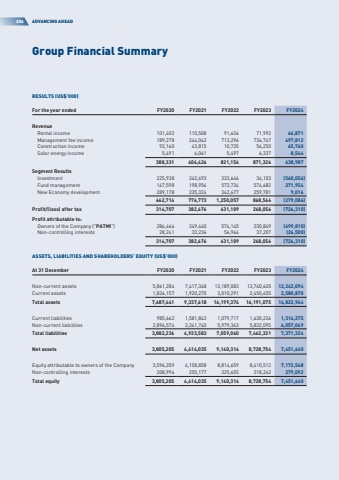
256ADVANCING AHEADGroup Financial SummaryRESULTS (US$%u2019000)For the year endedFY2020FY2021FY2022FY2023FY2024RevenueRental income101,402110,50891,62671,99266,871Management fee income189,278244,042713,296736,747497,812Construction income92,16043,81510,73556,25065,760Solar energy income5,4916,0615,4976,3378,544388,331404,426821,154871,326638,987Segment ResultsInvestment225,938342,493333,64634,103(560,056)Fund management147,598198,956573,734574,682271,954New Economy development289,178235,324342,677259,7819,016662,714776,7731,250,057868,566(279,086)Profit/(loss) after tax314,707382,676631,109268,056(726,310)Profit attributable to:Owners of the Company (\286,466349,440574,145230,849(699,810)Non-controlling interests28,24133,23656,96437,207(26,500)314,707382,676631,109268,056(726,310)ASSETS, LIABILITIES AND SHAREHOLDERS%u2019 EQUITY (US$%u2019000)At 31 DecemberFY2020FY2021FY2022FY2023FY2024Non-current assets5,861,2847,417,34813,189,08313,740,62012,242,094Current assets1,826,1571,920,2703,010,2912,450,4552,580,870Total assets7,687,4419,337,61816,199,37416,191,07514,822,964Current liabilities985,6621,581,8431,079,7171,630,2261,314,275Non-current liabilities2,896,5743,341,7405,979,3435,832,0956,057,049Total liabilities3,882,2364,923,5837,059,0607,462,3217,371,324Net assets3,805,2054,414,0359,140,3148,728,7547,451,640Equity attributable to owners of the Company3,596,2094,158,8588,814,6598,410,5127,172,548Non-controlling interests208,996255,177325,655318,242279,092Total equity3,805,2054,414,0359,140,3148,728,7547,451,640
