
Page 259 - Demo
P. 259
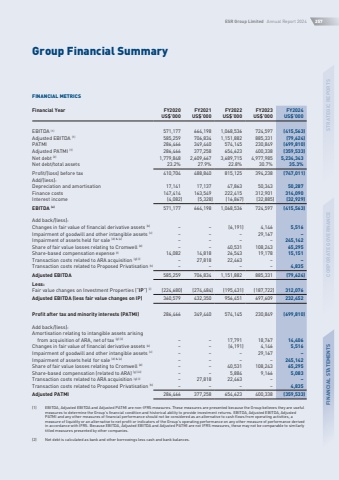
ESR Group Limited Annual Report 2024257STRATEGIC REPORTSCORPORATE GOVERNANCEFINANCIAL STATEMENTSGroup Financial SummaryFINANCIAL METRICSFinancial YearFY2020FY2021FY2022FY2023FY2024US$%u2019000US$%u2019000US$%u2019000US$%u2019000US$%u2019000EBITDA (1)571,177664,1981,068,536724,597(415,563)Adjusted EBITDA (1)585,259706,8341,151,882885,331(79,624)PATMI286,466349,440574,145230,849(699,810)Adjusted PATMI (1)286,466377,258654,623400,338(359,533)Net debt (2)1,779,8482,609,6673,689,7154,977,9855,234,343Net debt/total assets23.2%27.9%22.8%30.7%35.3%Profit/(loss) before tax410,704488,840815,125394,238(747,011)Add/(less):Depreciation and amortisation17,14117,13747,86350,34350,287Finance costs147,414163,549222,415312,901314,090Interest income(4,082)(5,328)(16,867)(32,885)(32,929)EBITDA (a)571,177664,1981,068,536724,597(415,563)Add back/(less):Changes in fair value of financial derivative assets (b)(6,191)4,1465,516Impairment of goodwill and other intangible assets (c)%u2013%u2013%u201329,167%u2013Impairment of assets held for sale (d) & (e)245,142Share of fair value losses relating to Cromwell (d)%u2013%u201340,531108,24365,295Share-based compensation expense (f)14,08214,81826,54319,17815,151Transaction costs related to ARA acquisition (g) (i)%u201327,81822,463%u2013%u2013Transaction costs related to Proposed Privatisation (h)4,835Adjusted EBITDA585,259706,8341,151,882885,331(79,624)Less:Fair value changes on Investment Properties (%u201cIP%u201d) (i)(224,680)(274,484)(195,431)(187,722)312,076Adjusted EBITDA (less fair value changes on IP)360,579432,350956,451697,609232,452Profit after tax and minority interests (PATMI)286,466349,440574,145230,849(699,810)Add back/(less):Amortisation relating to intangible assets arising from acquisition of ARA, net of tax (g) (ii)17,79118,76714,406Changes in fair value of financial derivative assets (b)%u2013%u2013(6,191)4,1465,516Impairment of goodwill and other intangible assets (c)29,167%u2013Impairment of assets held for sale (d) & (e)%u2013%u2013%u2013%u2013245,142Share of fair value losses relating to Cromwell (d)40,531108,24365,295Share-based compensation (related to ARA) (g) (iii)%u2013%u20135,8849,1665,083Transaction costs related to ARA acquisition (g) (i)27,81822,463%u2013Transaction costs related to Proposed Privatisation (h)%u2013%u2013%u2013%u20134,835Adjusted PATMI286,466377,258654,623400,338(359,533)(1)EBITDA, Adjusted EBITDA and Adjusted PATMI are non-IFRS measures. These measures are presented because the Group believes they are useful measures to determine the Group%u2019s financial condition and historical ability to provide investment returns. EBITDA, Adjusted EBITDA, Adjusted PATMI and any other measures of financial performance should not be considered as an alternative to cash flows from operating activities, a measure of liquidity or an alternative to net profit or indicators of the Group%u2019s operating performance on any other measure of performance derived in accordance with IFRS. Because EBITDA, Adjusted EBITDA and Adjusted PATMI are not IFRS measures, these may not be comparable to similarly titled measures presented by other companies.(2)Net debt is calculated as bank and other borrowings less cash and bank balances.
